Cisco collaboration
e-book
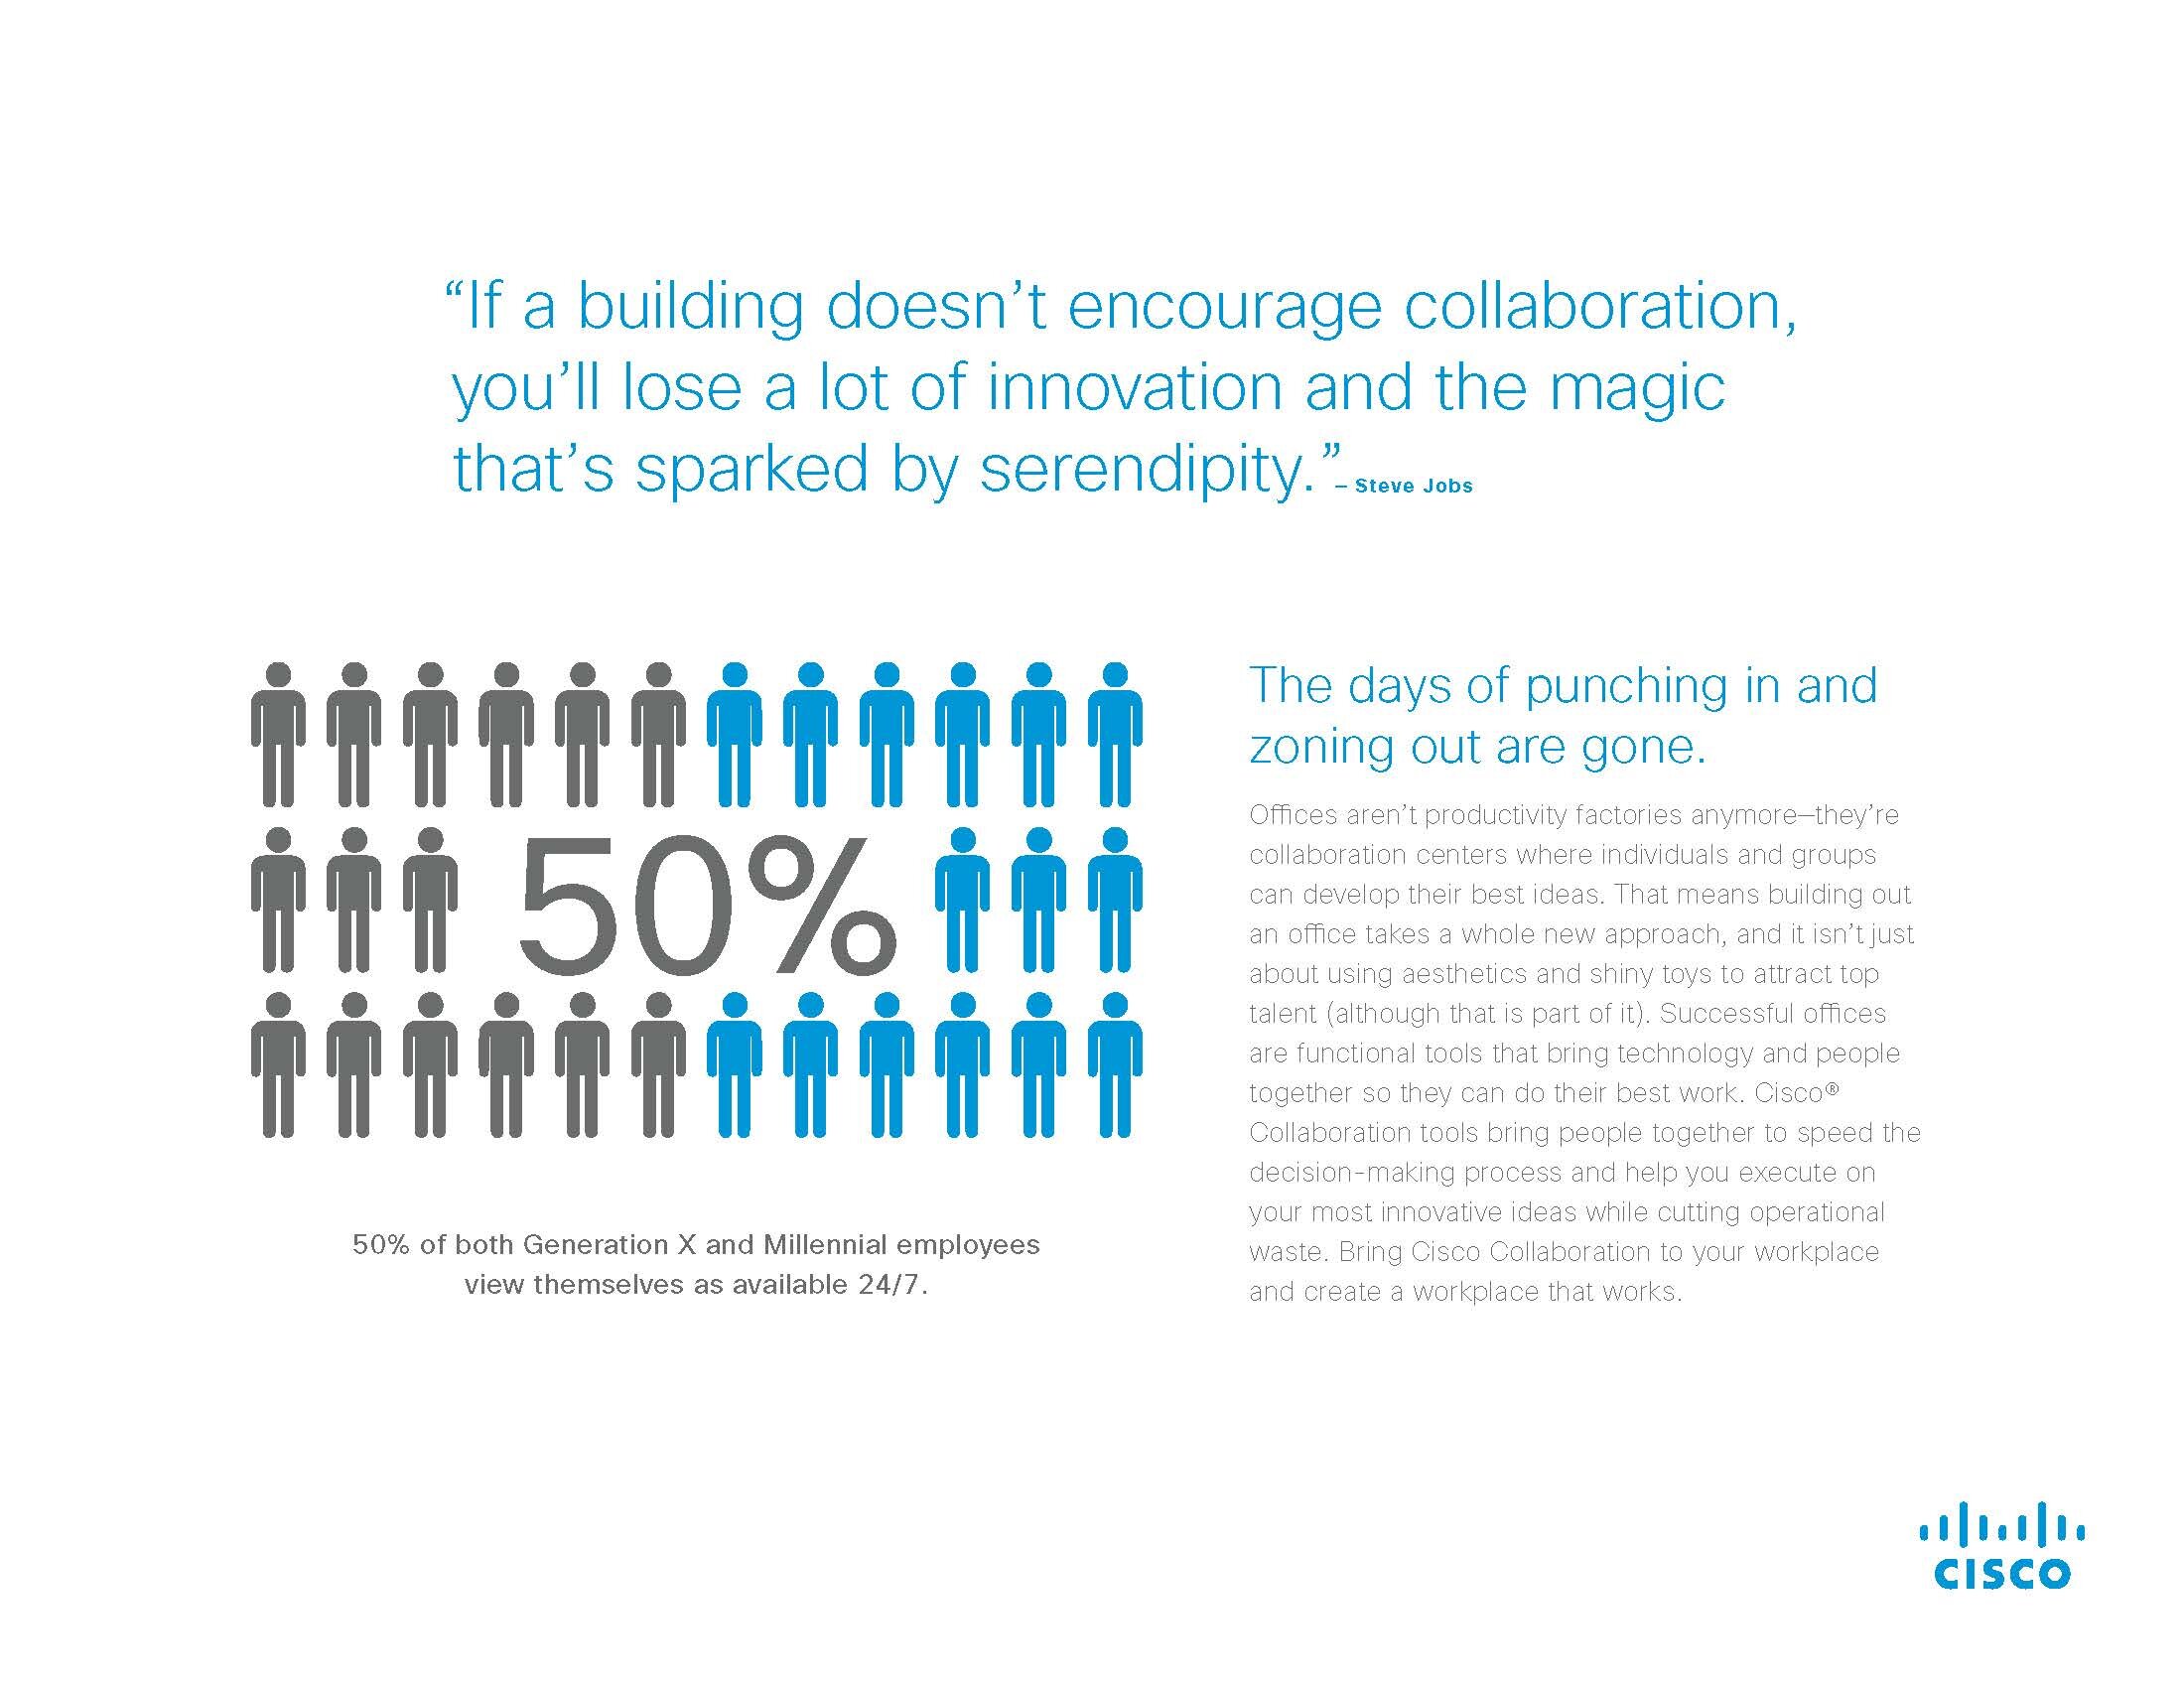
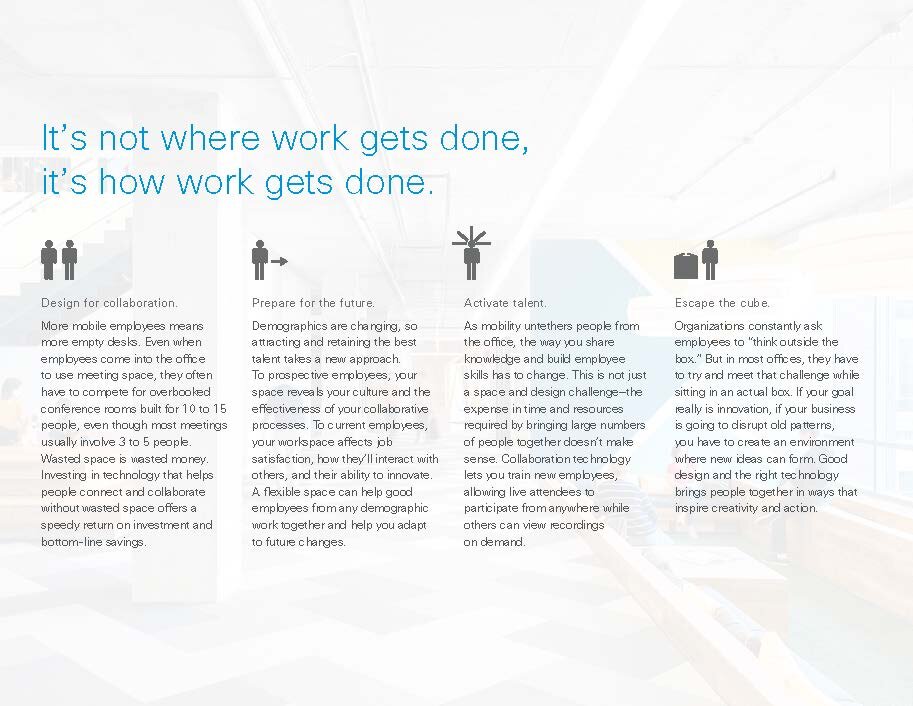
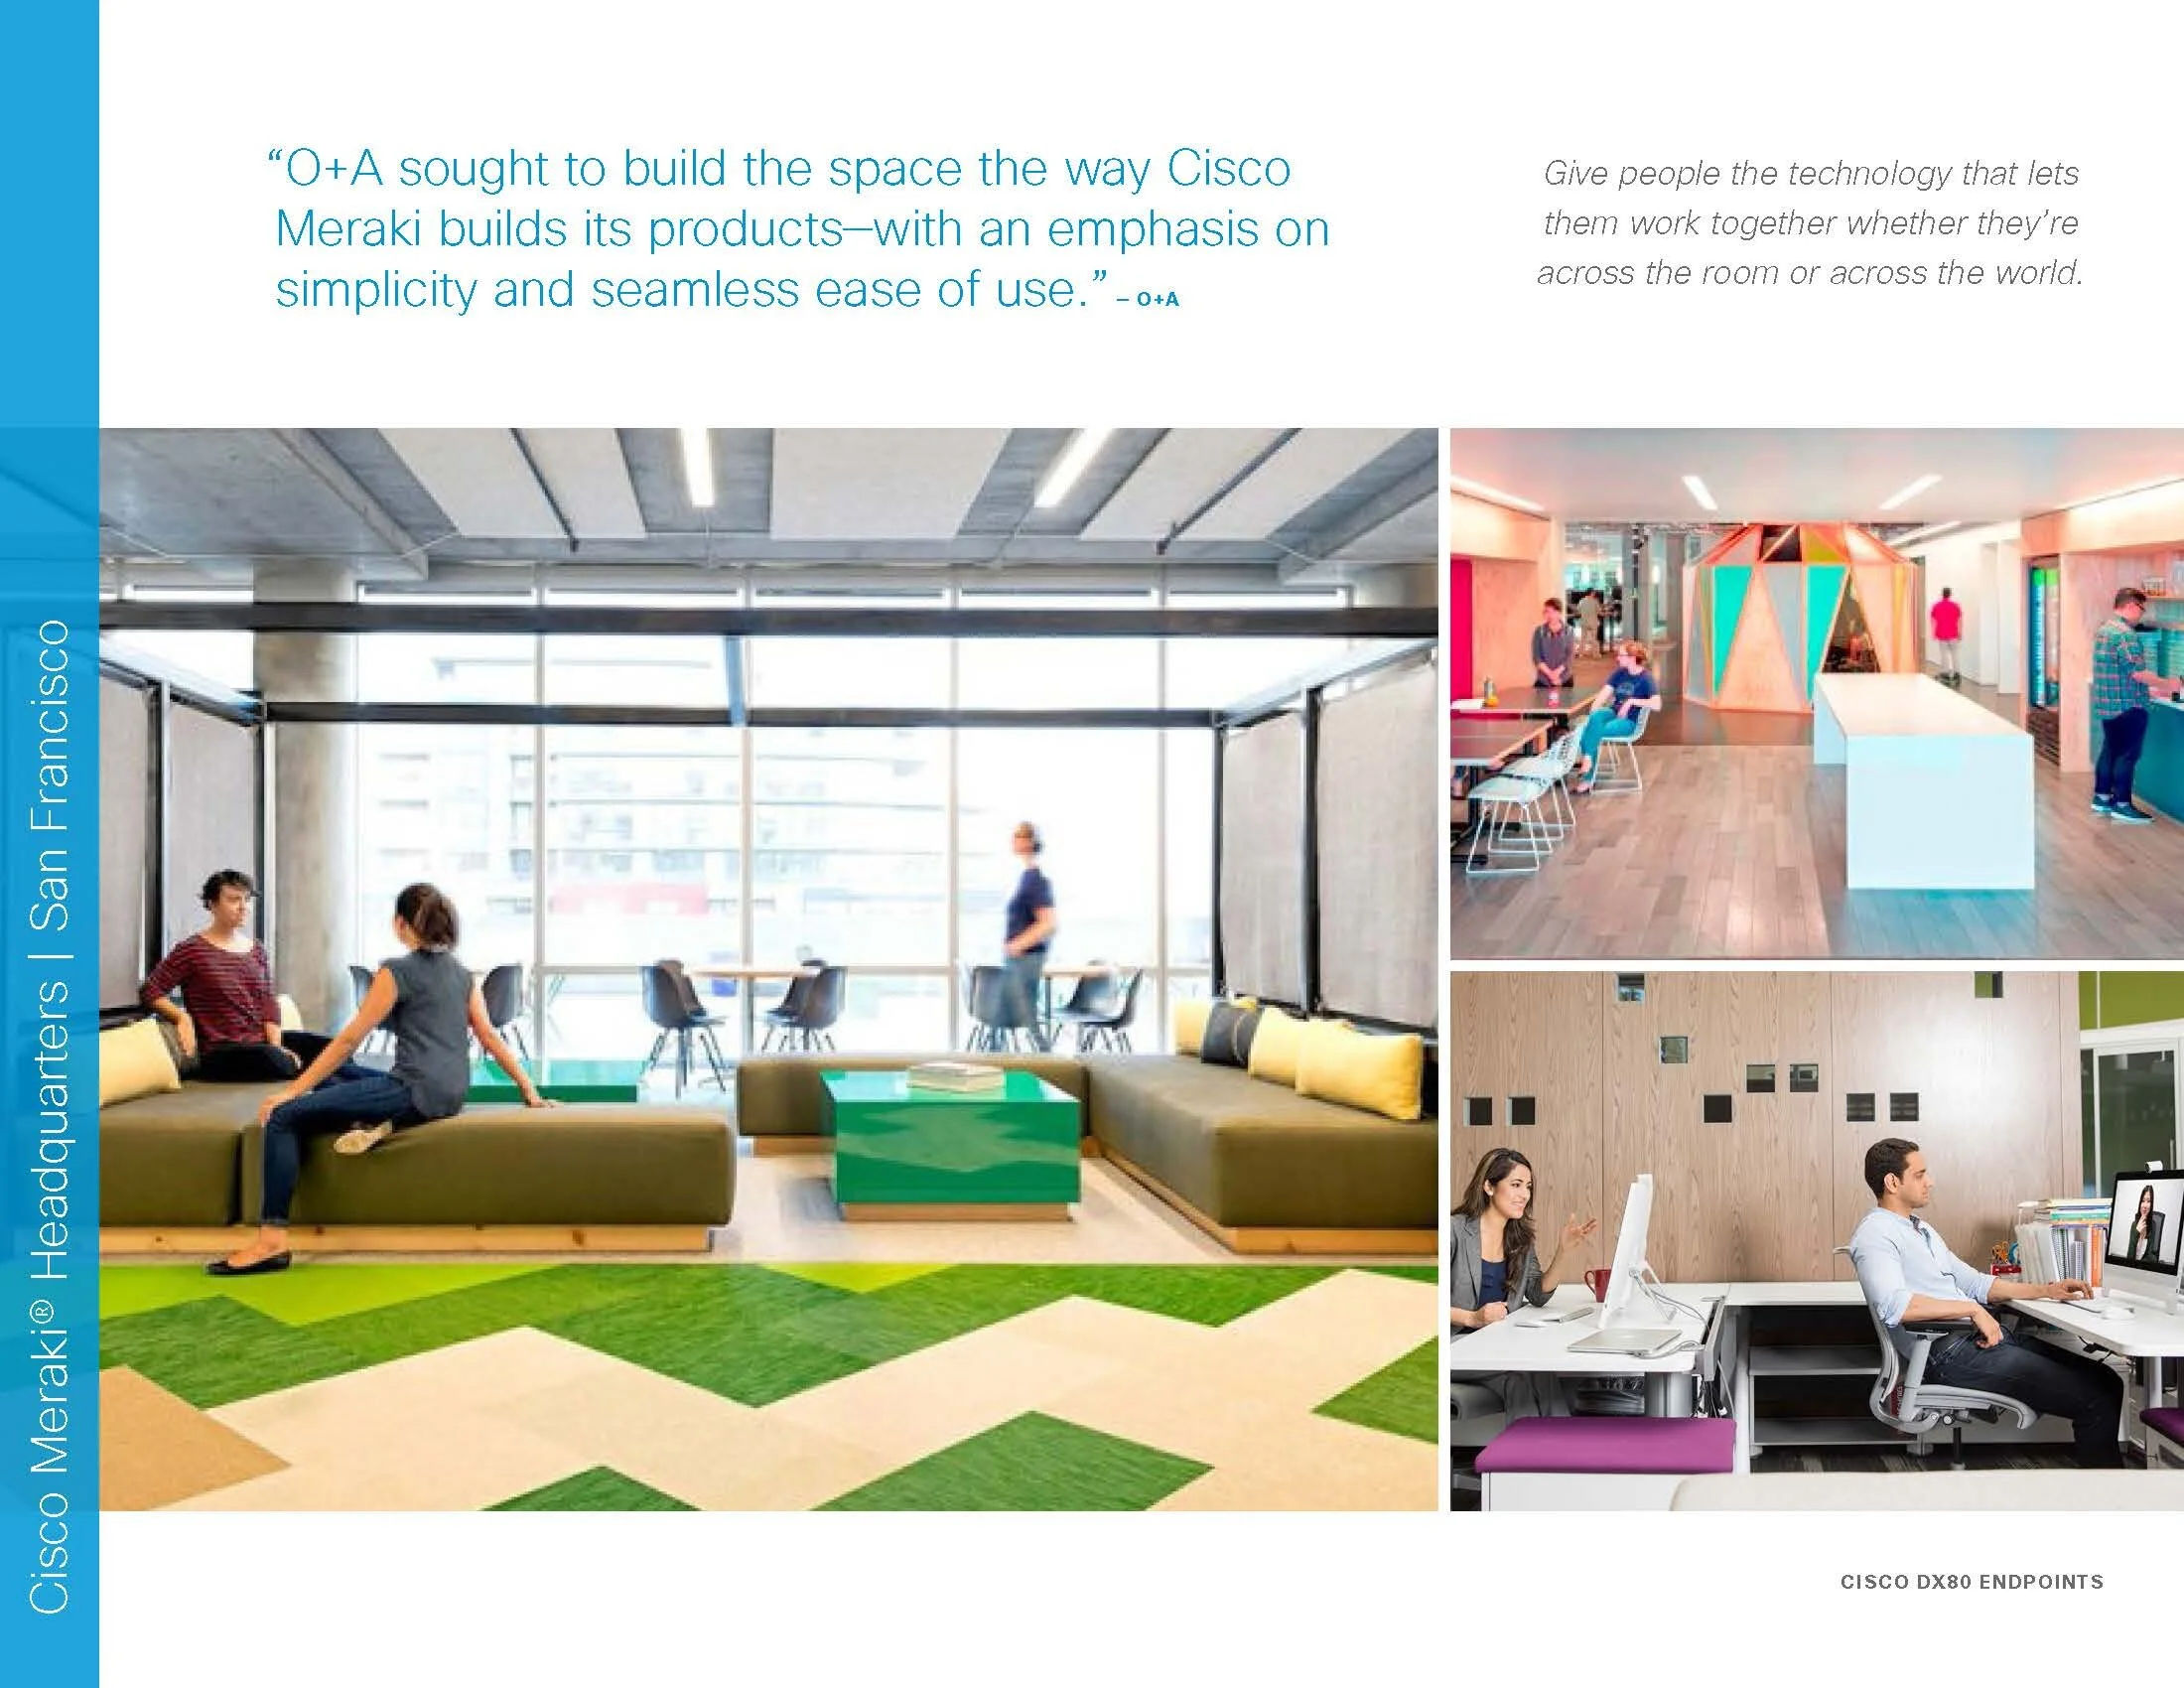
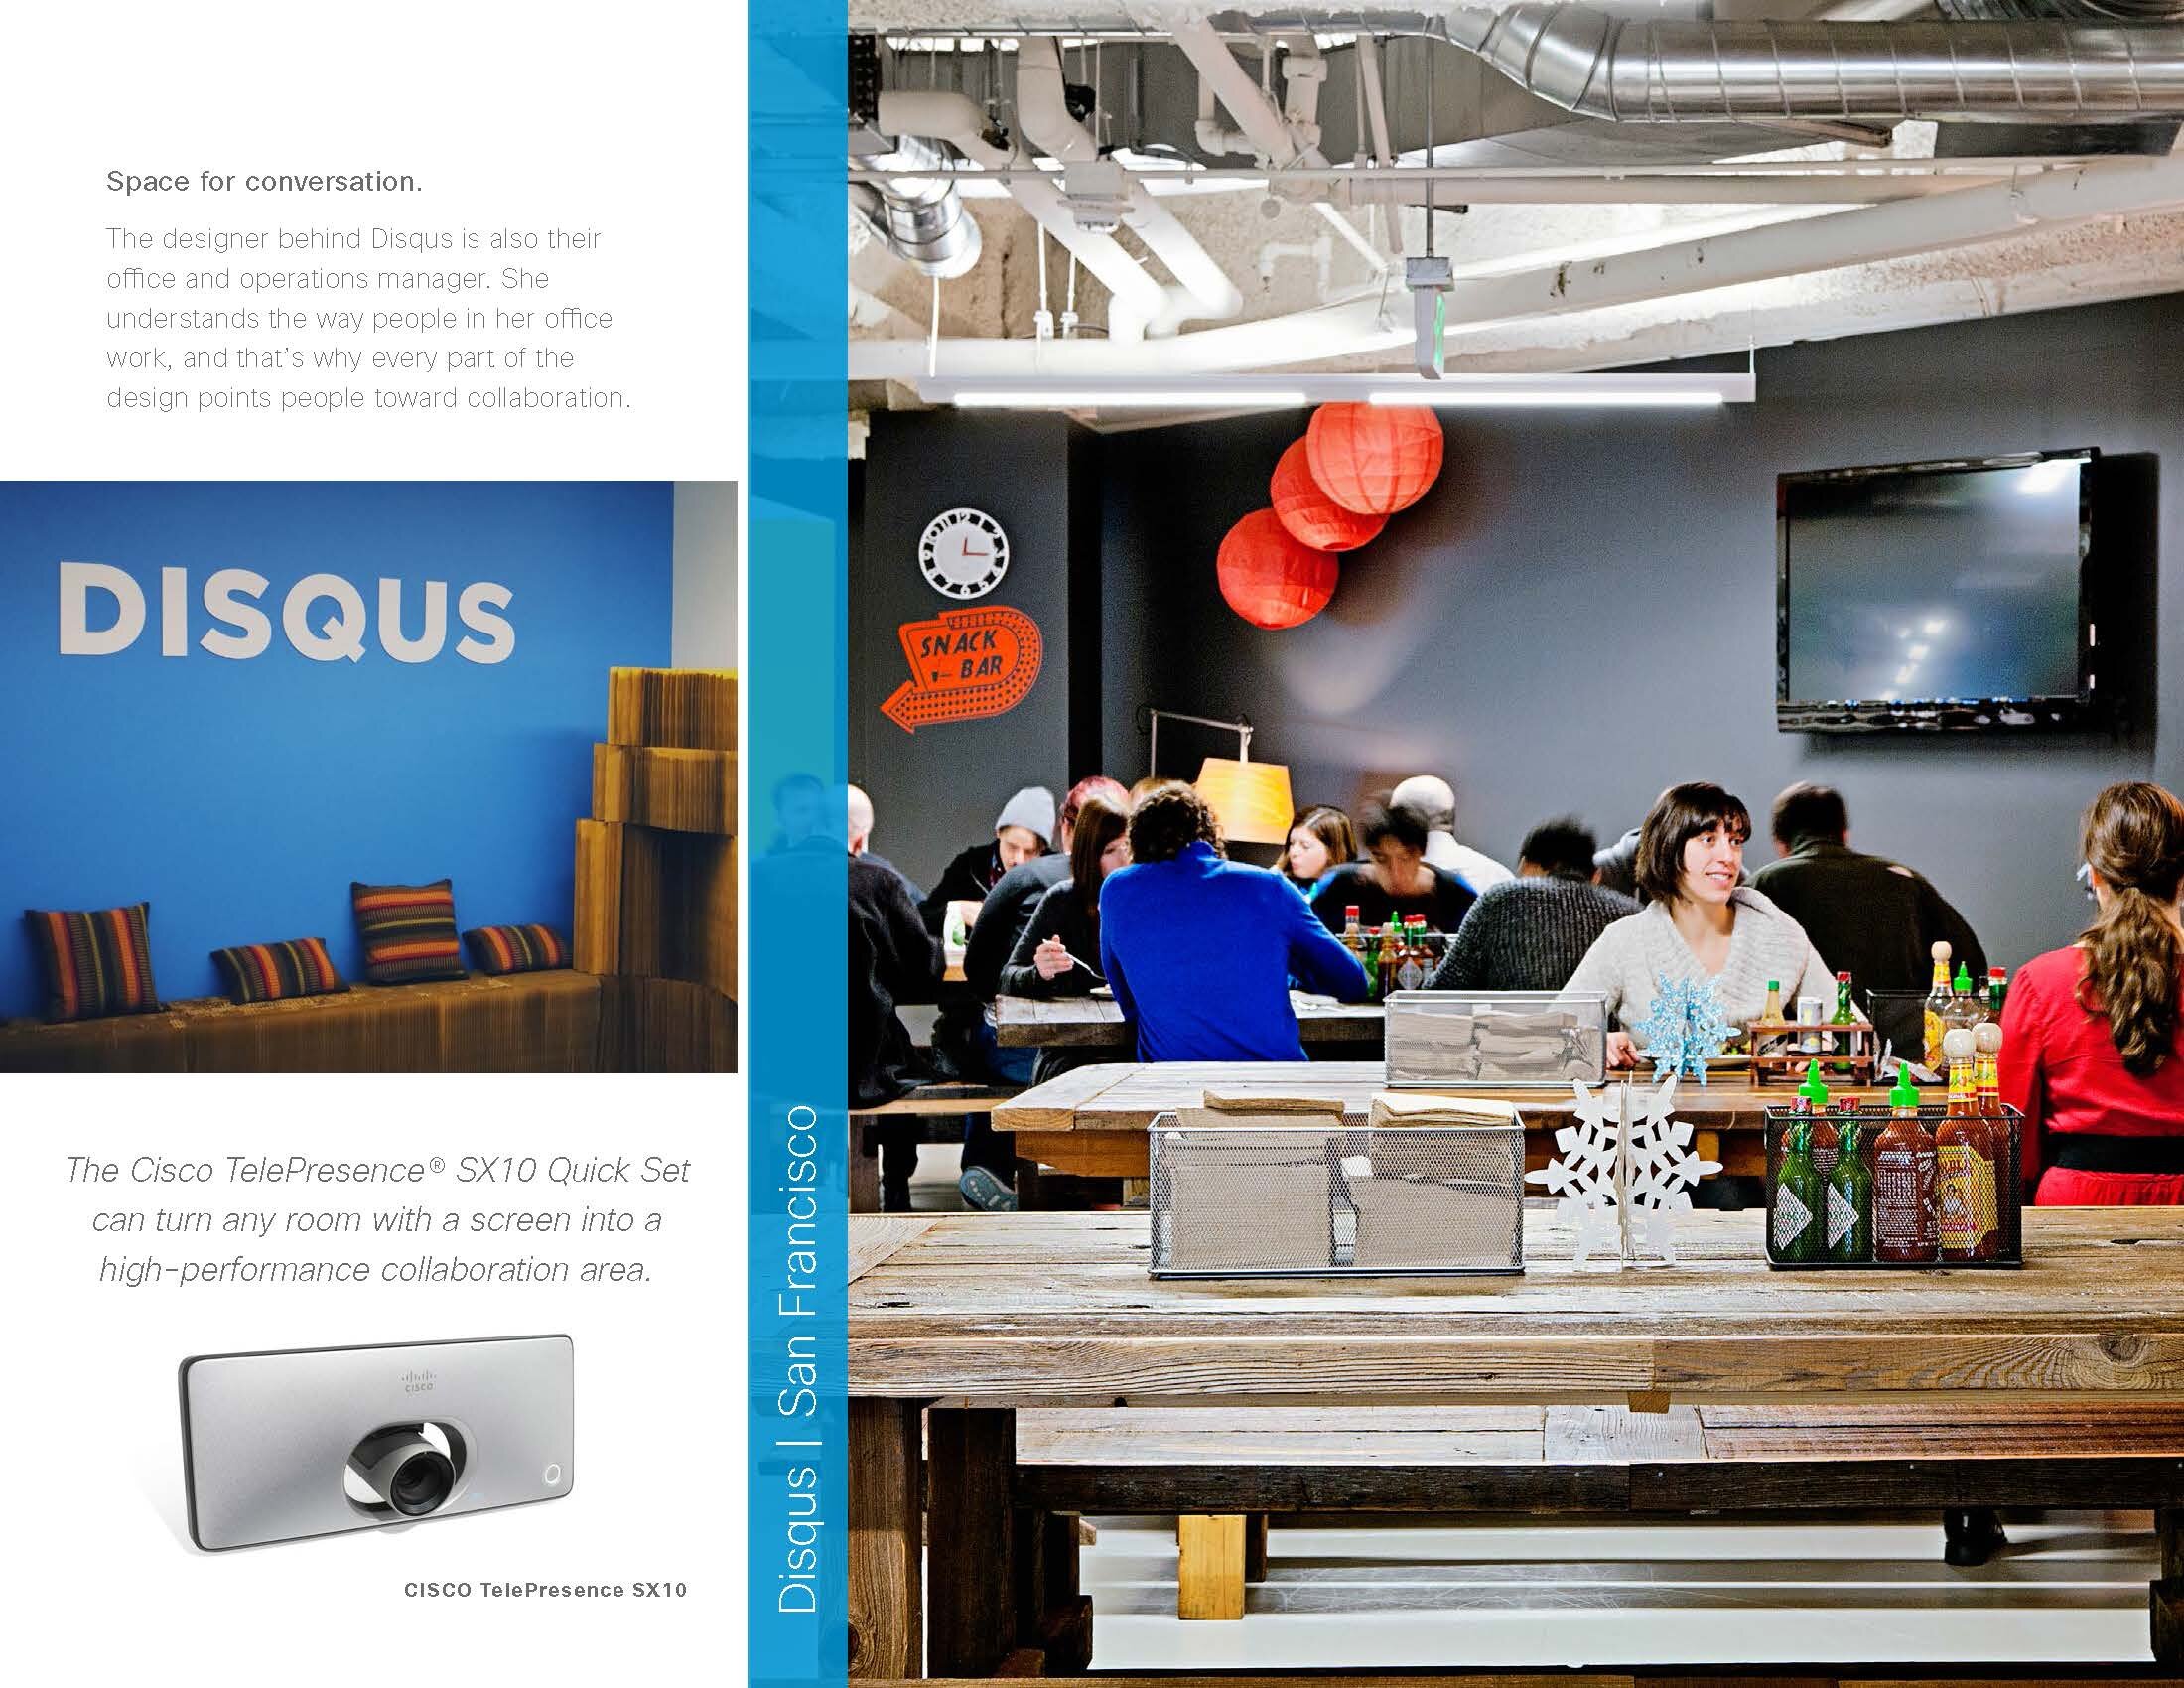
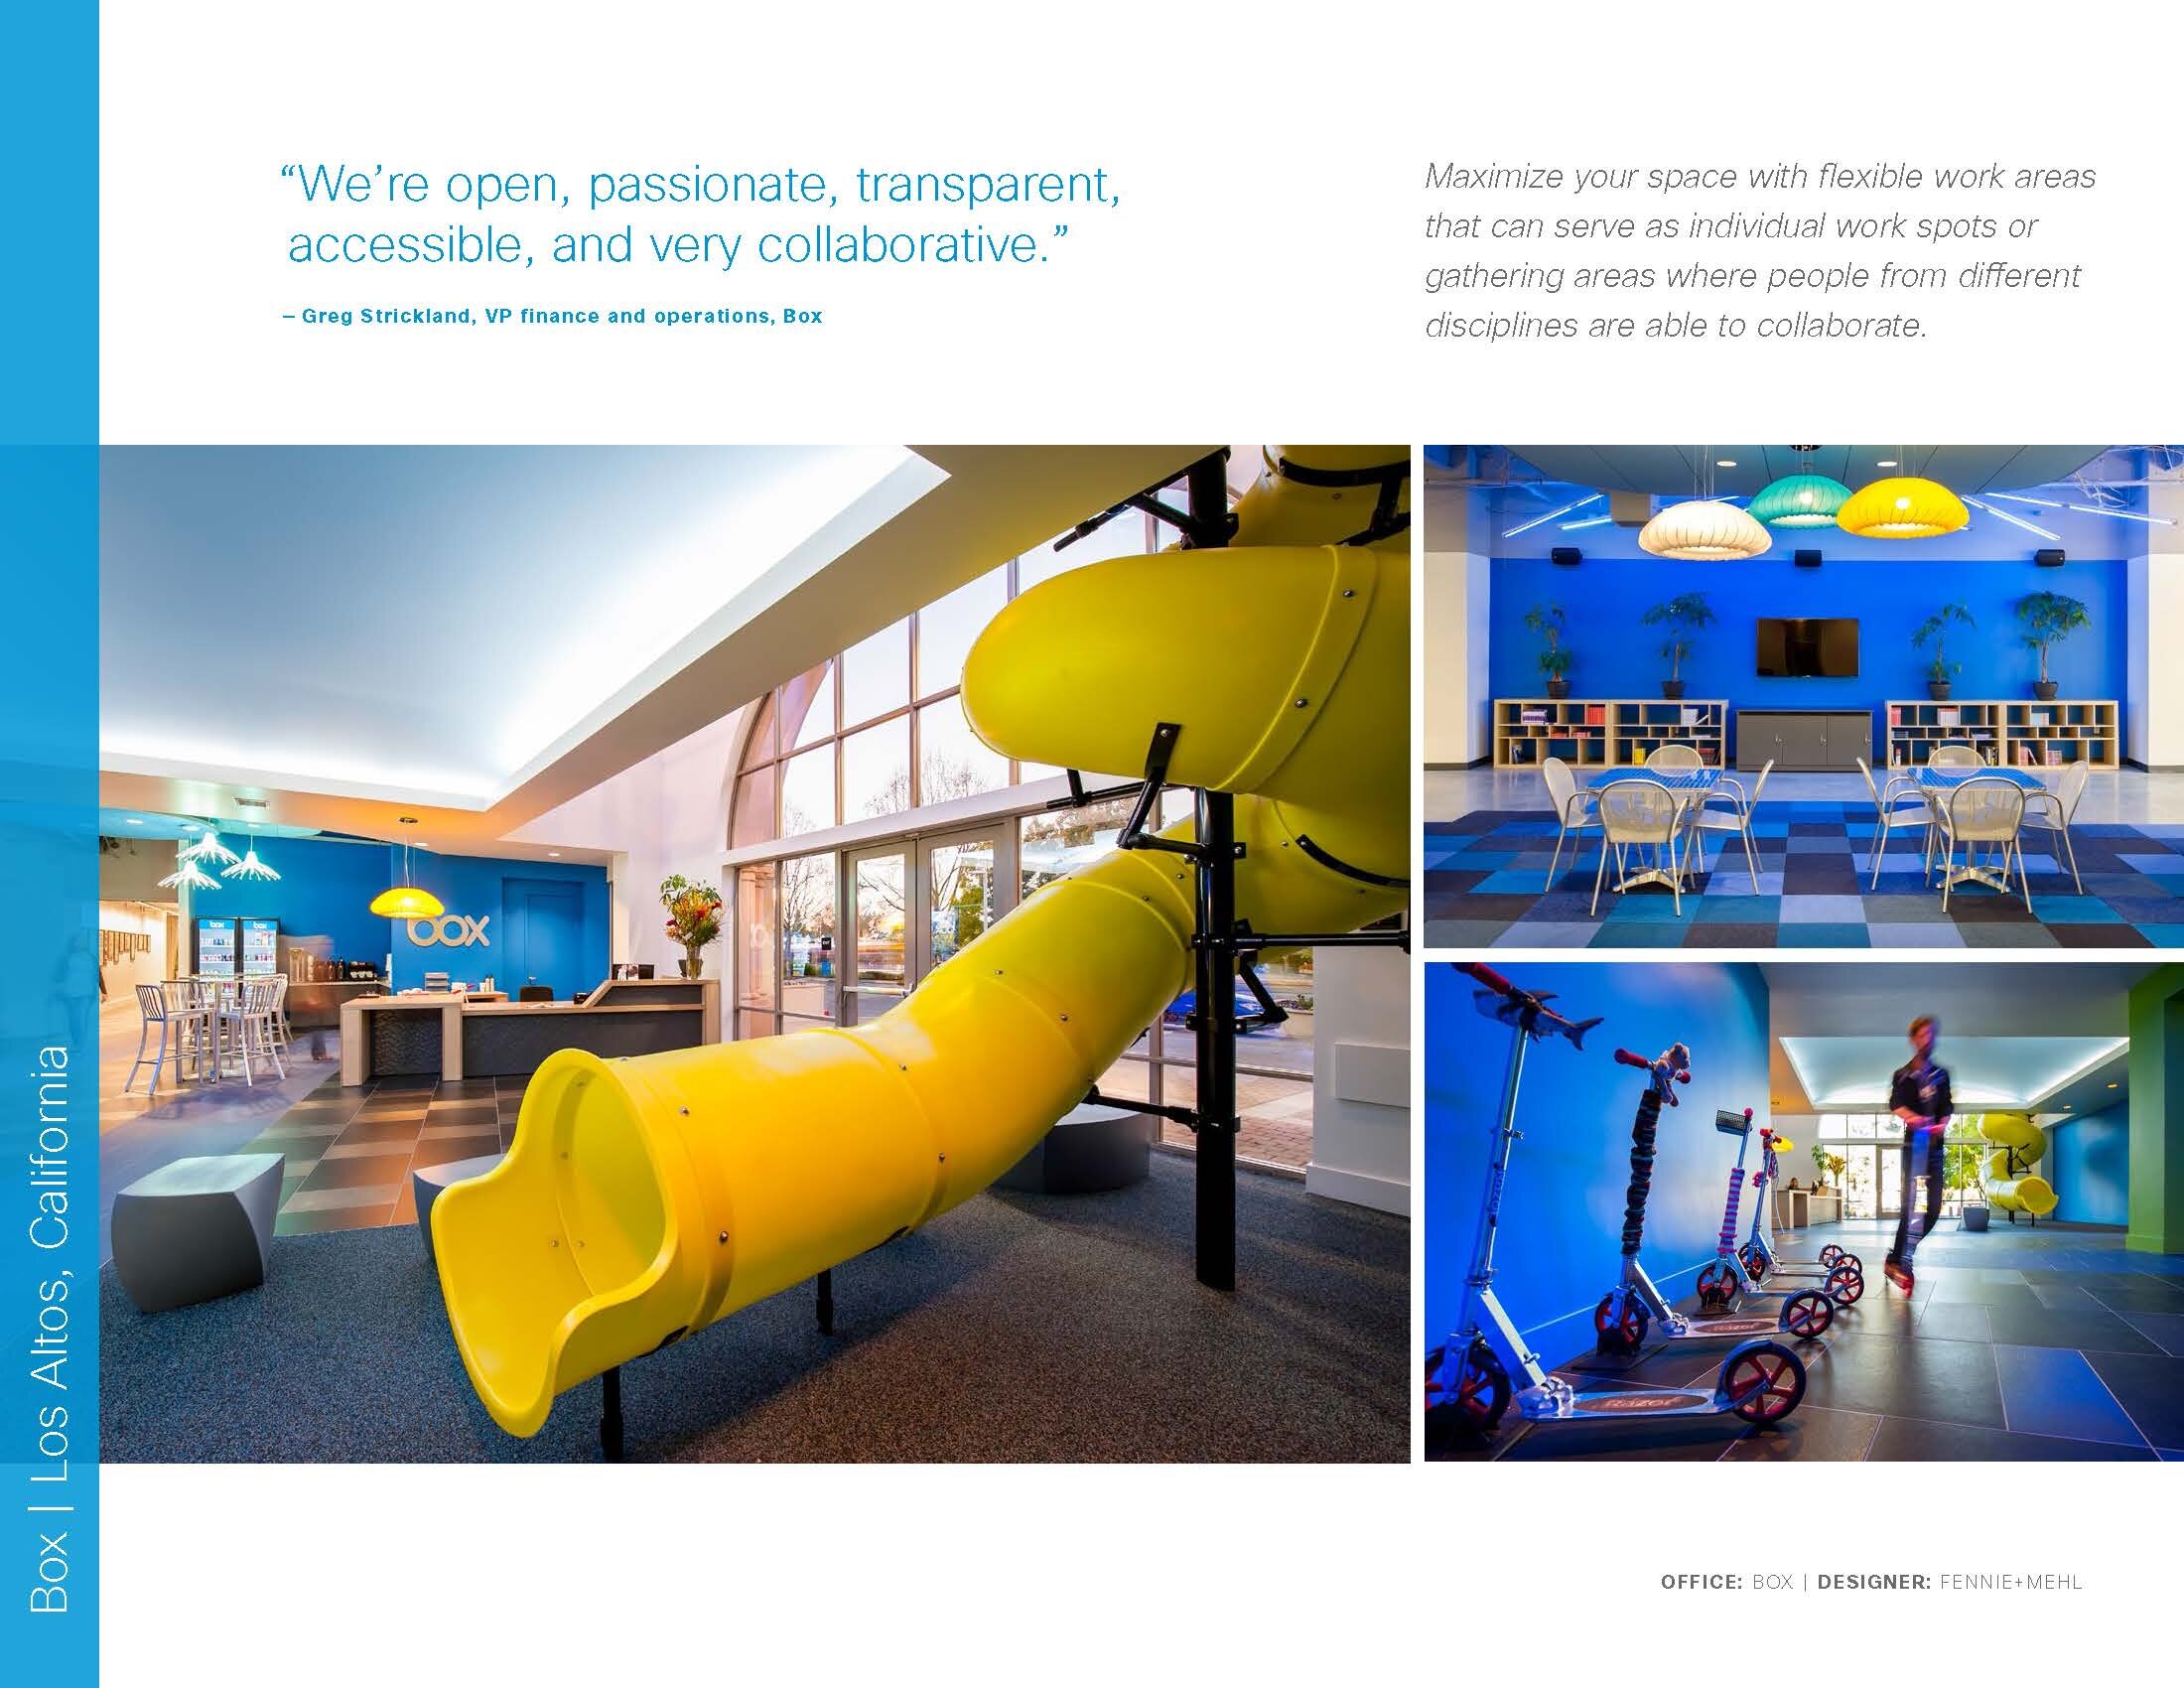
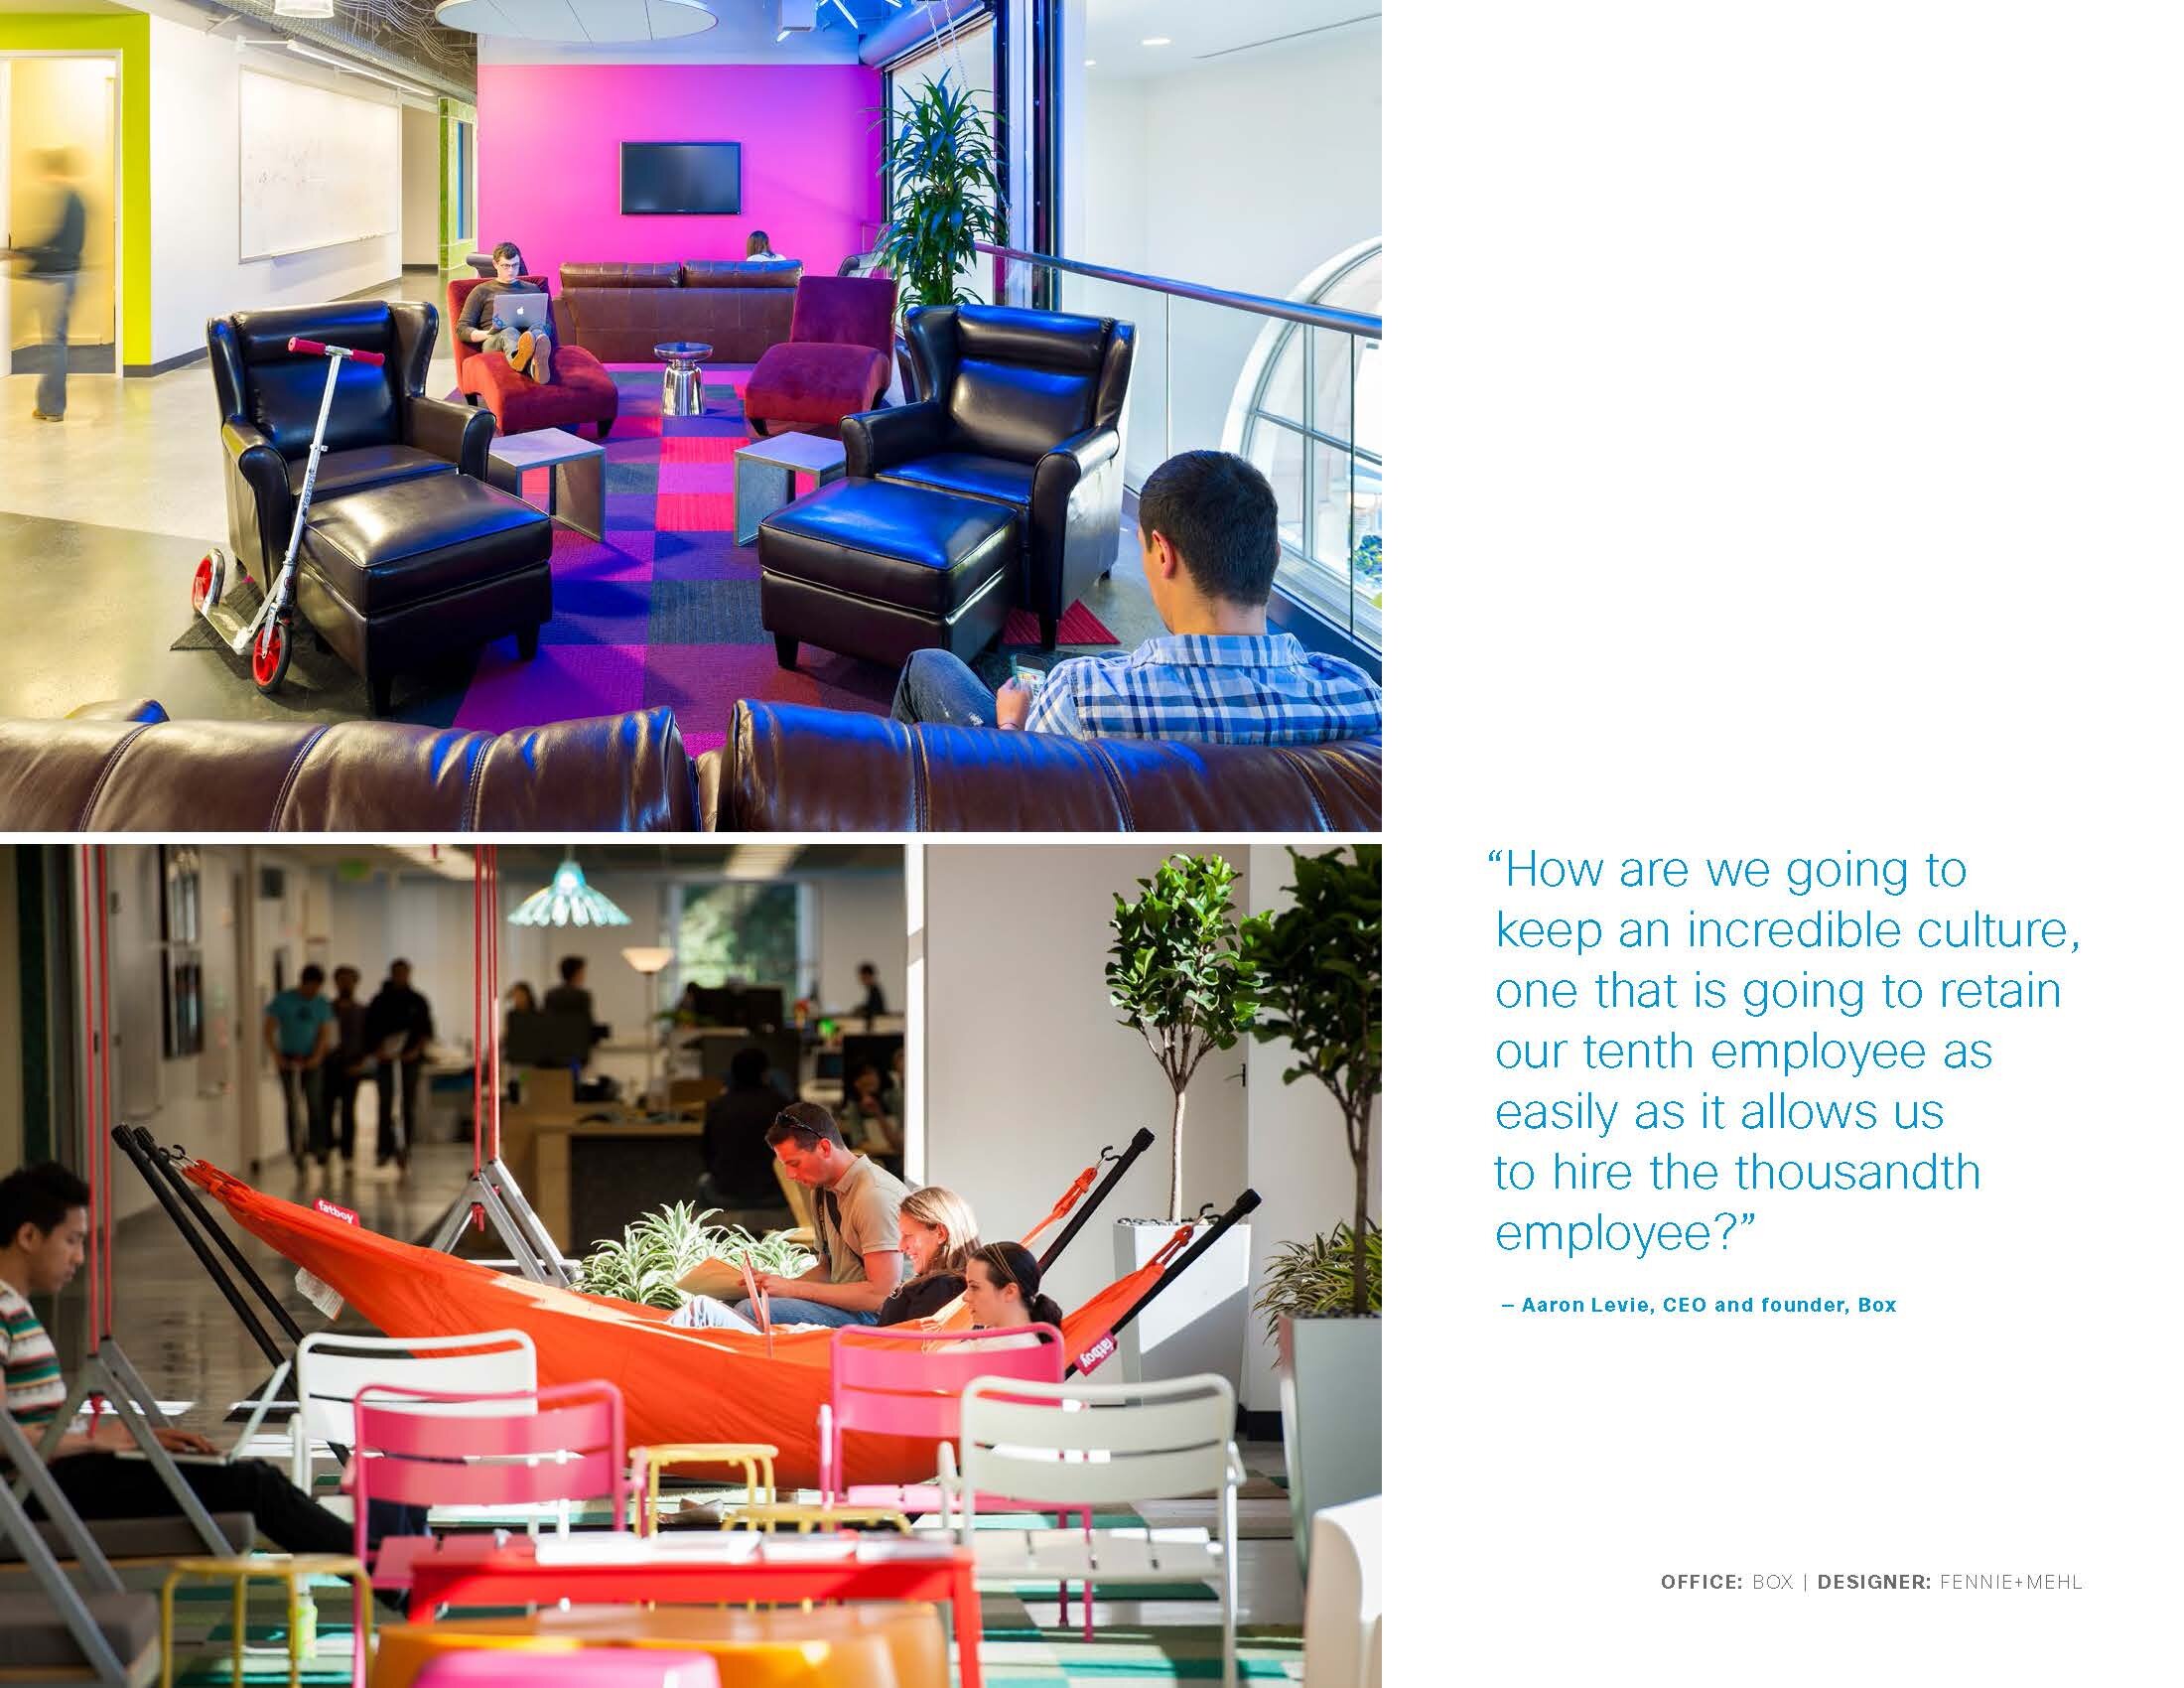
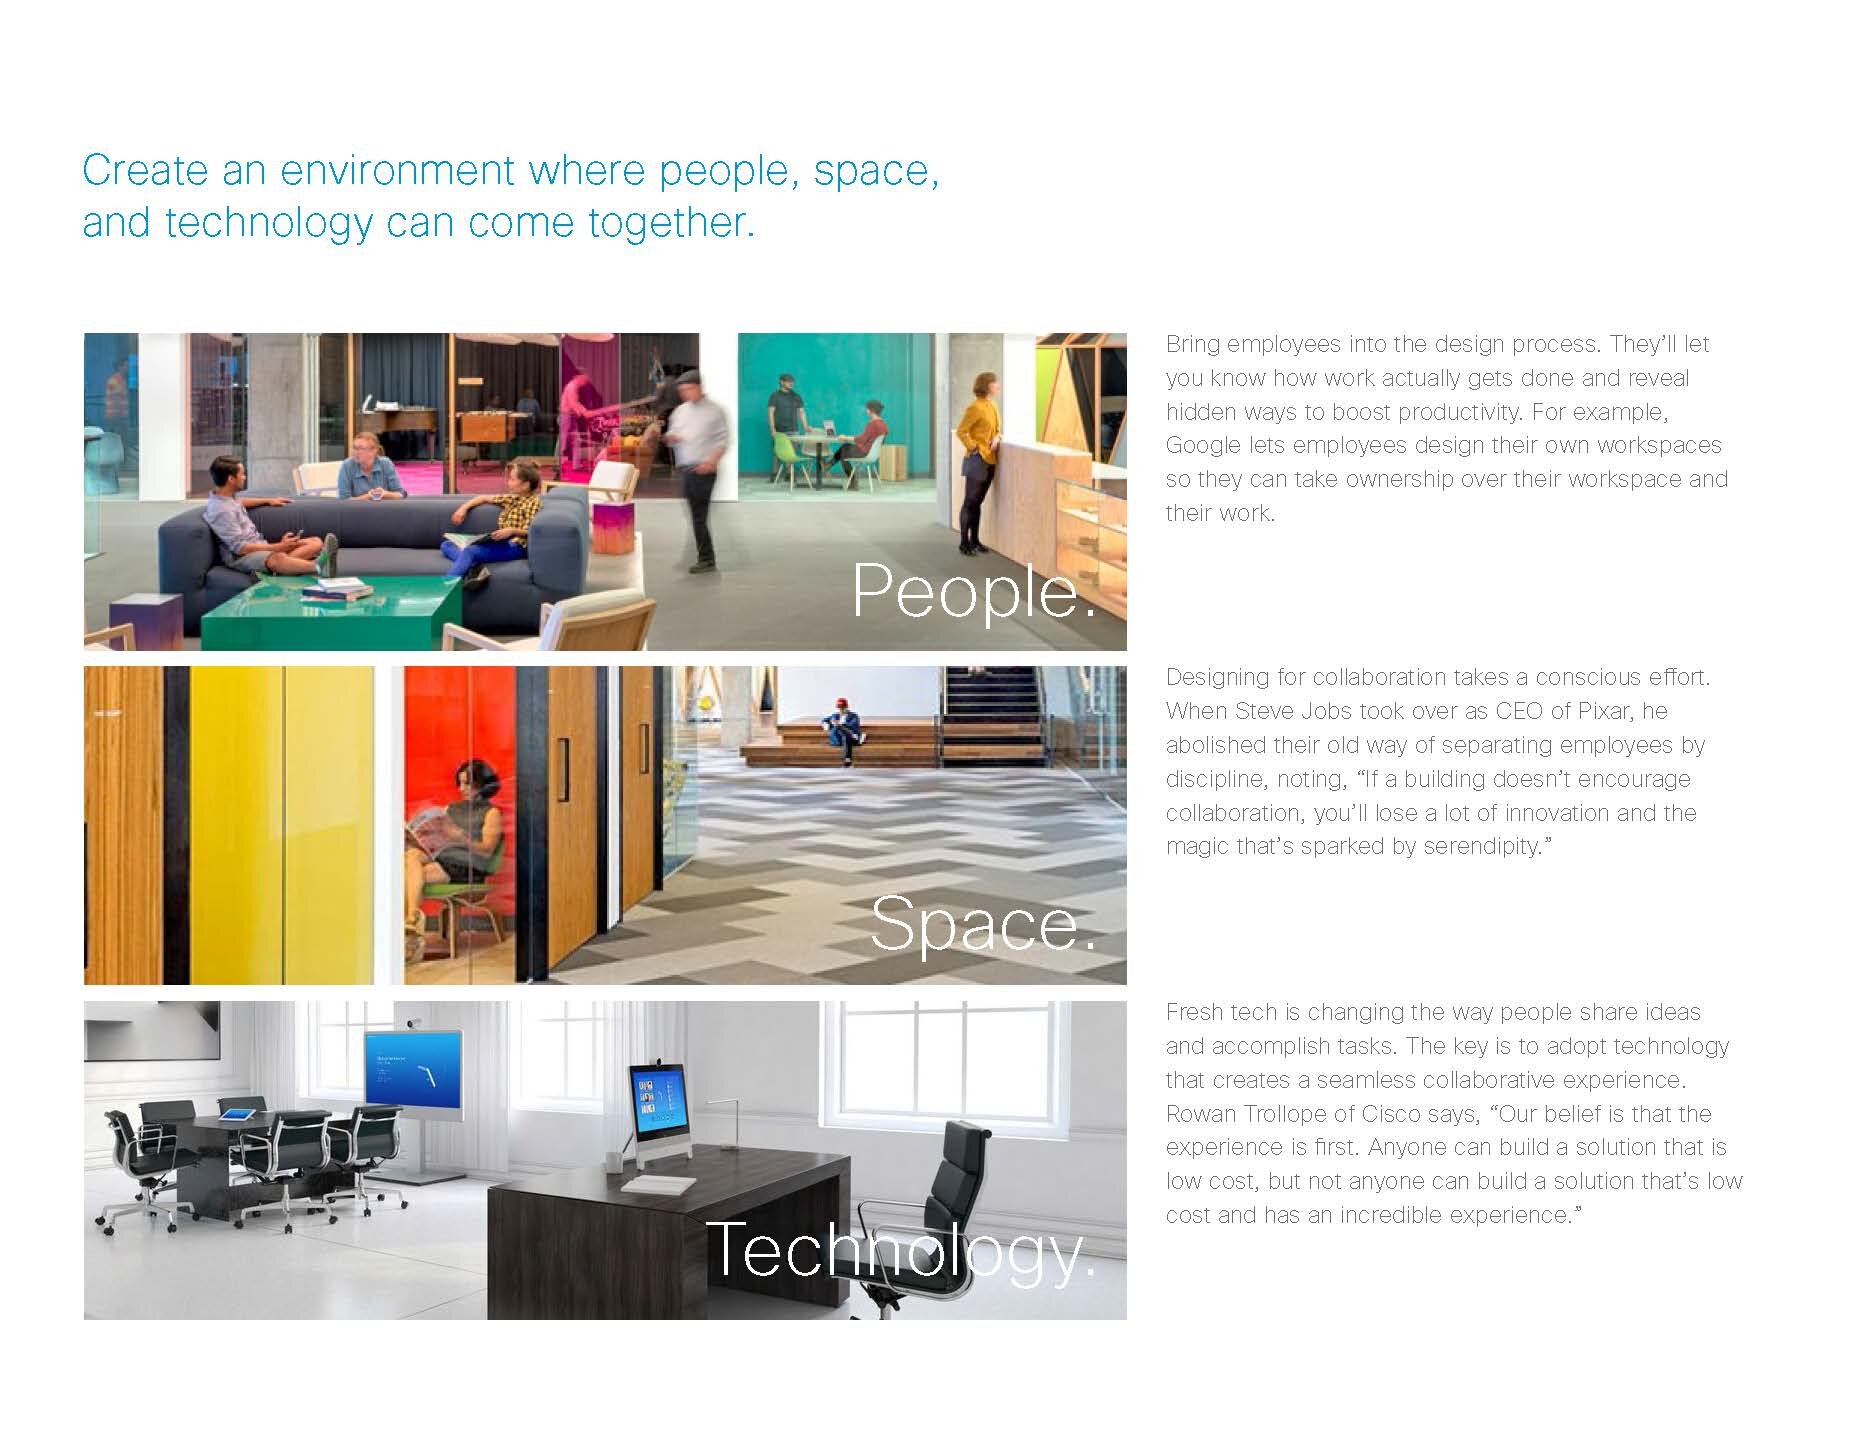
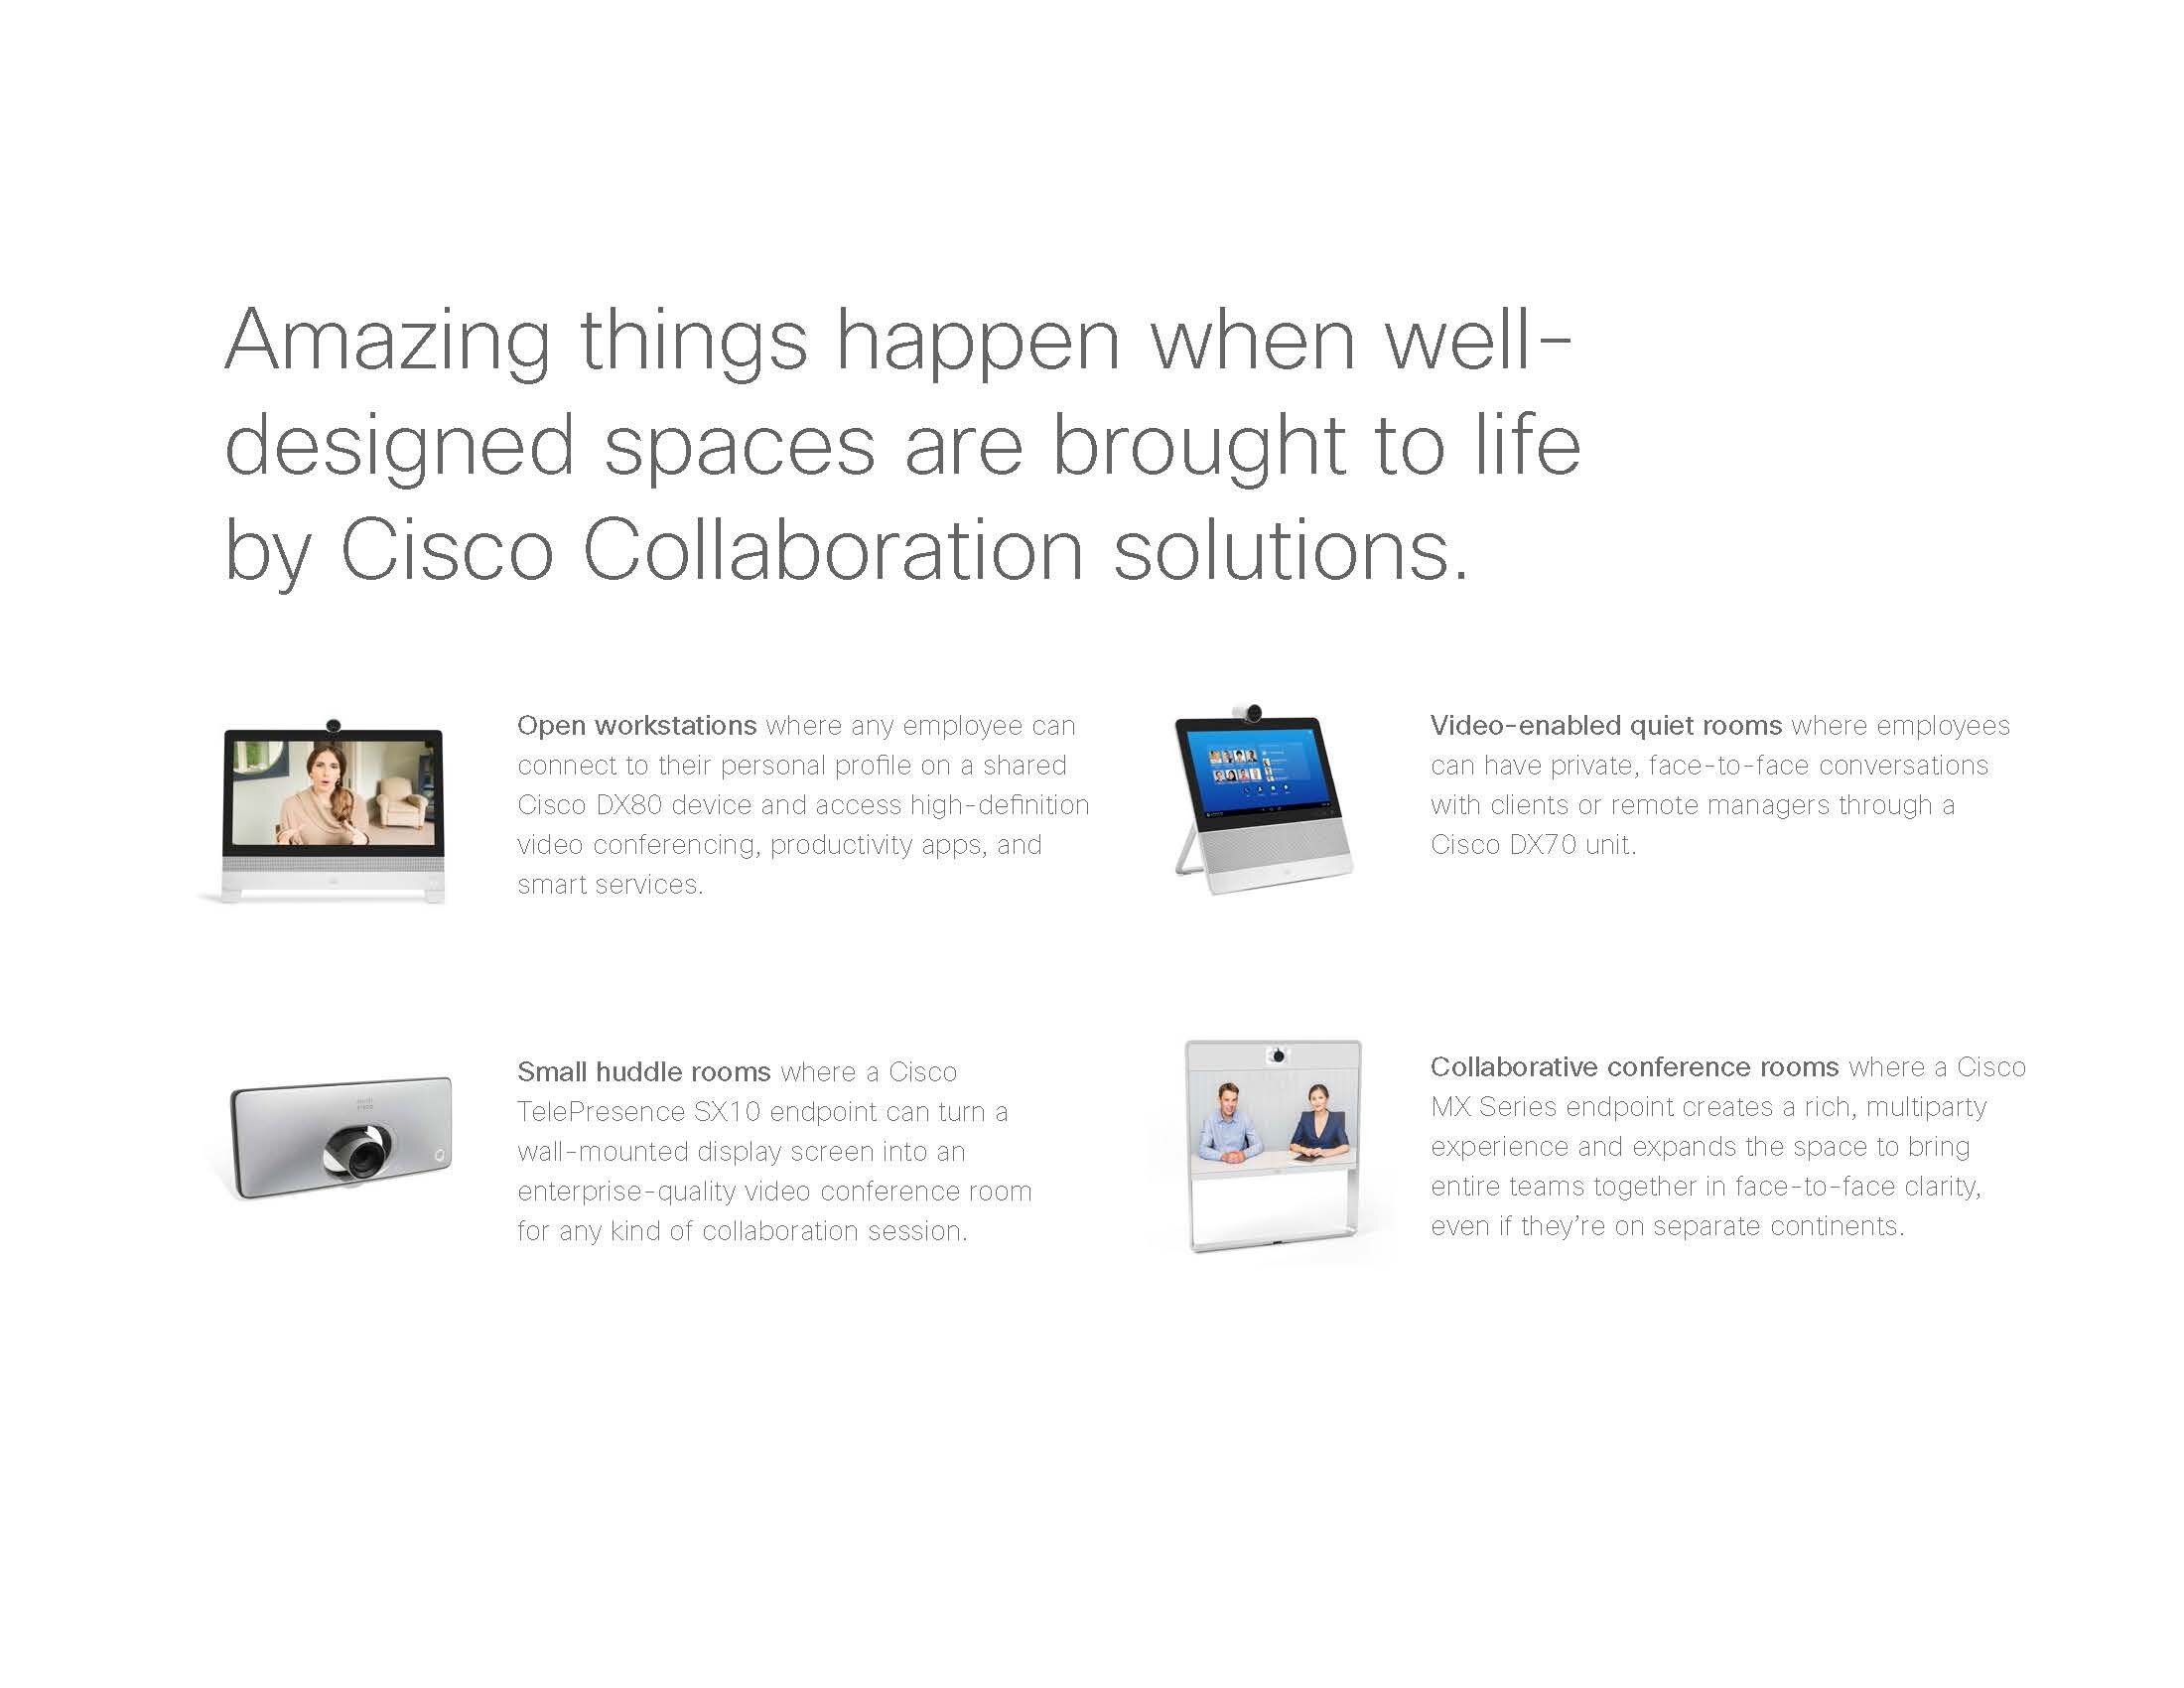
Cisco asked for an e-book demonstrating what happens when you combine smart physical spaces with Cisco collaboration technology. I found ways to break up pages of copy and turn stats into fun-sized info-bites.
Quick note on presenting stats: it’s really common to turn stats into pie charts, but human brains have a really hard time pulling numerical values out of circular shapes (3.14 x the radius of what?). Use literal visual representations for data, and your info will be more impactful. End of sermon.